How to perform structural assessment of Victorian granite offshore lighthouses starting from 19th century archive drawings
This was another challenge of the STORMLAMP project. This was what we had to figure out in UCL and this post presents how we have done so.
The first step in creating a numerical model of the structure is to know its geometry. In this we were quite lucky, the archive drawings of the design and construction gave a pretty insightful view. The problem? We had to digitalise this information, creating CAD models based on these 19th century archive drawings (Figure 1). Wherever there were written dimensions, this was easy. But this was not the case everywhere. Measuring dimensions on the deformed 150 years old drawings (in digital version hence even more distortions) has not been a straightforward approach. But it was successfully carried out.
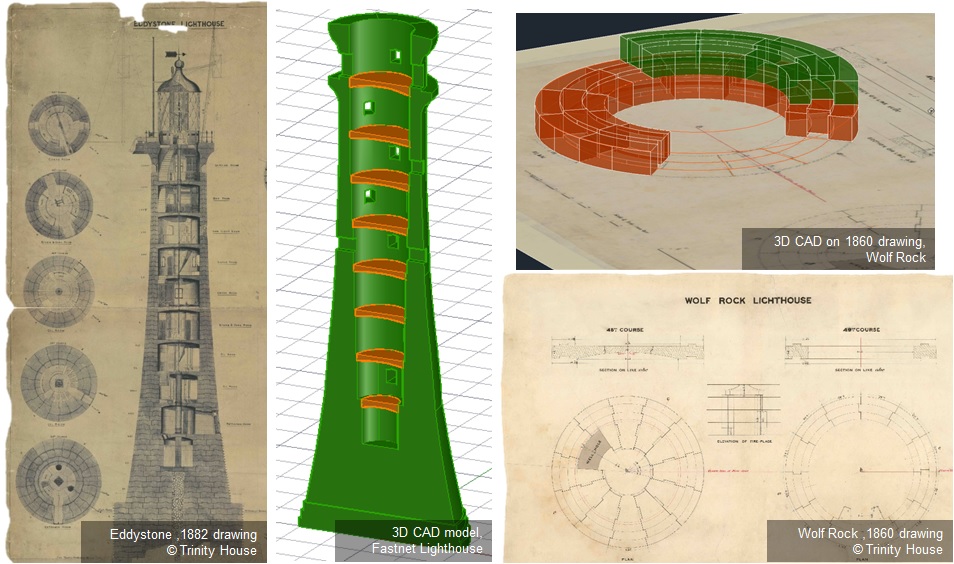
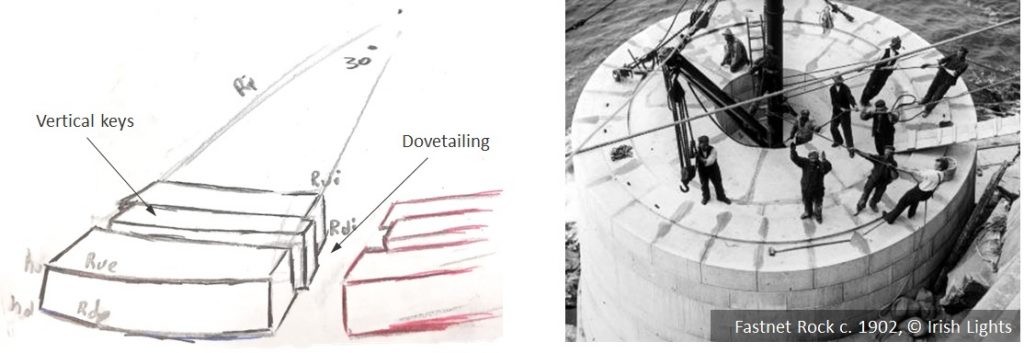
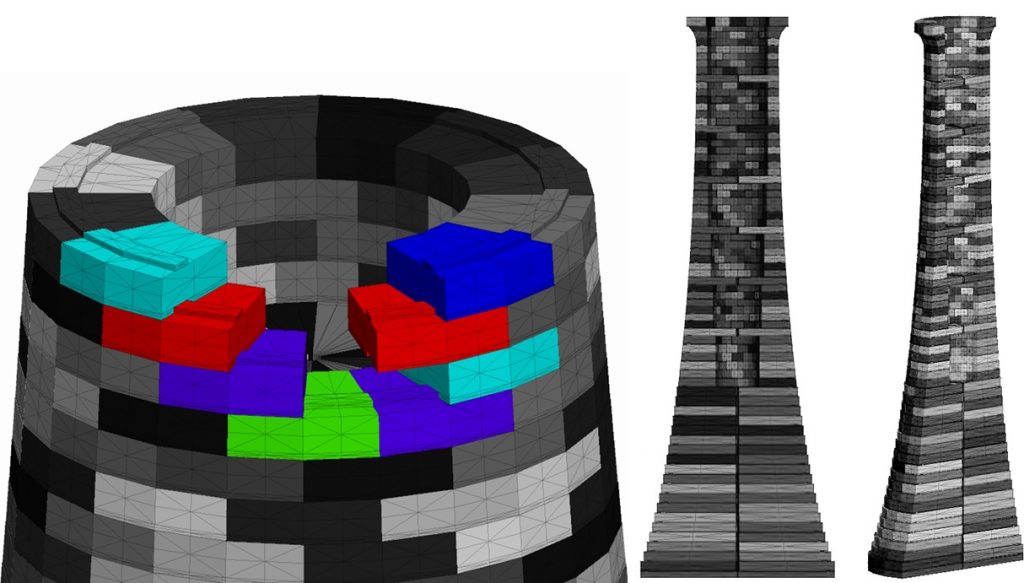
Initially, the “Finite Element Method” (FEM) software Abaqus 6.14 of Dassault Systèmes was used for the structural analysis. However, we soon discovered that a homogeneous continuous model is not able to capture realistically the structural response of such a complex structure. The lighthouses of this typology are built with an ingenious system of interlocked granite blocks. See the drawing below and the figures above. The presence of dovetailing and vertical keys makes prohibits relative sliding between the blocks while it allows uplift and rocking between consecutive courses of stones. This highly non-linear behaviour is impossible to be captured by a continuous FEM model.
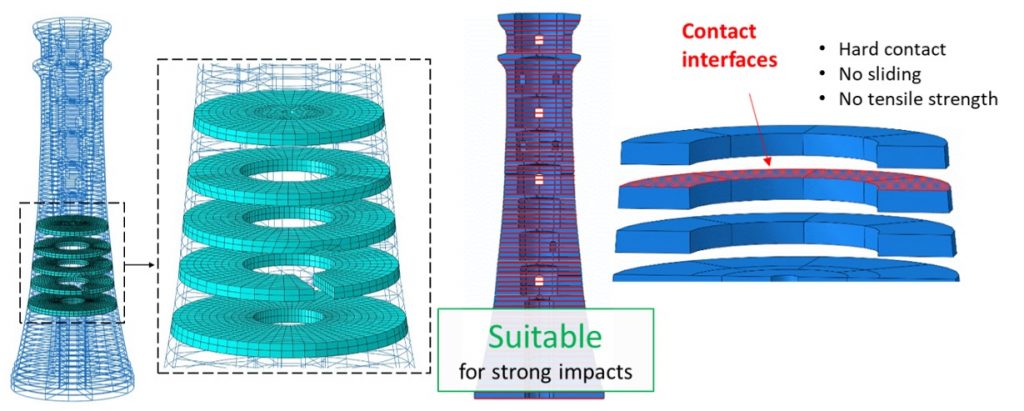
Therefore, and after having tried different alternatives (more details here), we carried on with a more sophisticated approach. We modelled the structure as discontinuous but with contact interfaces between the courses (see Figure 3). Such a model can reproduce the opening of horizontal joints, therefore simulating the rocking behaviour. However, there is a very big drawback: extreme computational cost. An analysis of 2 seconds of model time required around 48 hours of computing time in a workstation with 12 cores and 128 GB ram.
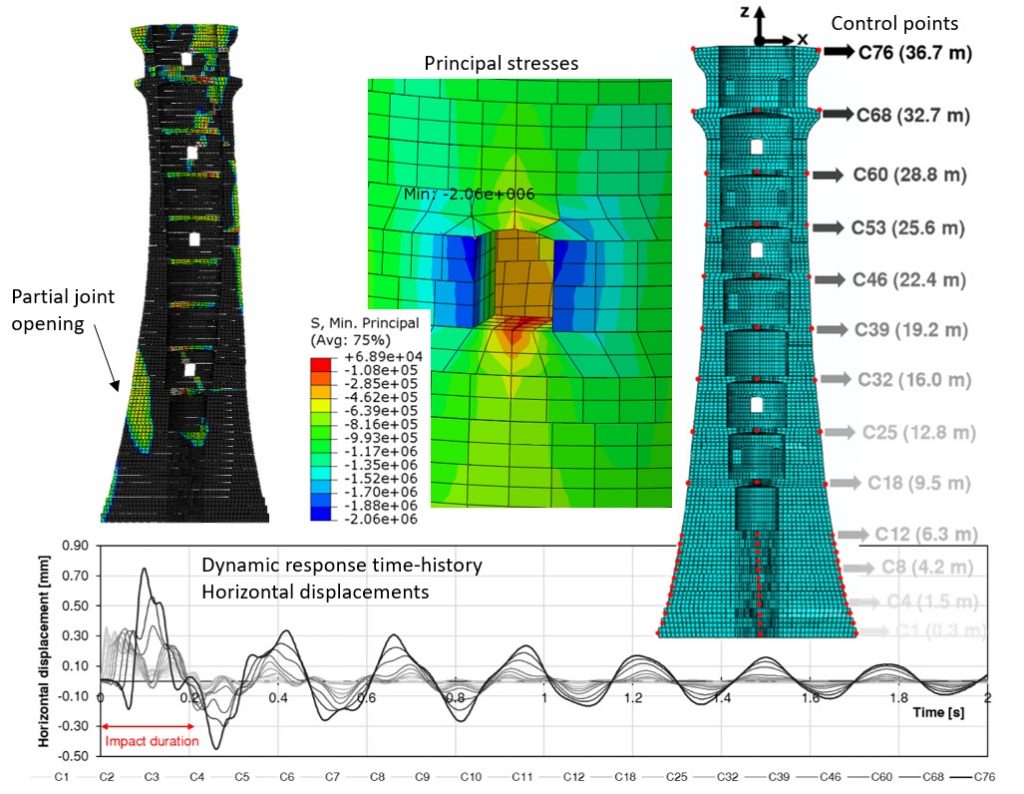
After having calibrated the material properties of FEM models, in terms of modes of vibration and modal frequencies (more details here), based on the experimental dynamic identification results, we were ready to run analyses for wave impact scenarios. This technique with contact interfaces, although very time consuming for creating and running the model, was able to reveal the stress levels, joint openings, vertical and horizontal displacements as a results of different wave impacts.
We analysed the scenario of the 250 year return period wave impacting the historic lighthouse of Fastnet Rock, south of Ireland (Figure 4). The structural analysis revealed modest values of maximum horizontal and vertical displacements and also low levels of principal stresses. Furthermore, the resulting displacements were in the order of magnitude of just 1 mm, while the compressive and tensile stresses remained rather low. This suggests that, even though the lighthouse was designed and built more than 100 years ago, the structure is not threatened by the current wave action.
We were very happy with the results of the discontinuous FEM approach, but then we wanted something even better. We wanted an analysis method that would require much less computational time, allow for an easier creation of the model, and enable modelling of more structural details like the vertical keys that prevent sliding. The solution was the “Distinct (often called Discrete) Element Method” (DEM). We used the DEM software 3DEC of Itasca Inc. Anyone who is familiar with DEM software programs could disagree that it allows for “easier creation of the model” . Indeed, they are right, 3DEC is was not the handiest software for creating a lighthouse model. Almost everything had to be coded. So, after writing “just” 500 lines of Python code, we had a script that can create the geometry of any lighthouse with the sole geometry inputs of external and internal diameter, keying dimensions, and height for each course of stones. See the Wolf Rock lighthouse DEM model in Figure 5.
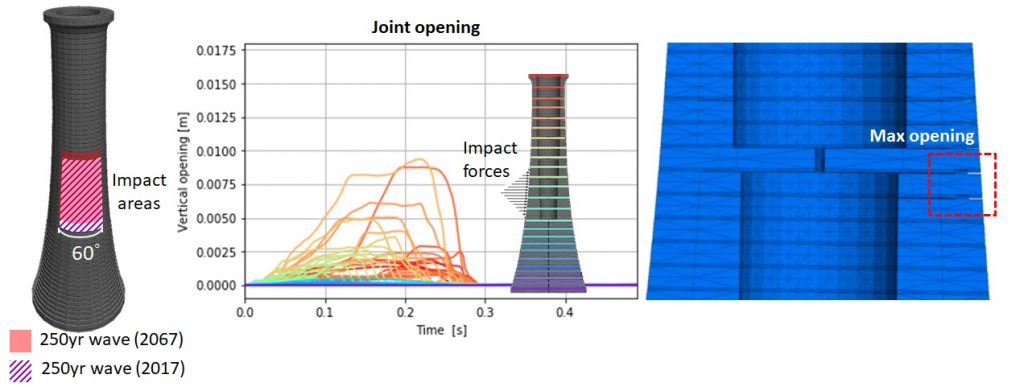
We used the DEM model of Wolf Rock for the analysis of extreme impact, identification for 250 year return period wave using a Bayesian method taking also into consideration different scenarios regarding the prediction of the sea level rise due to climate change (scenarios of 2017 and 2067 sea level). The forces are applied between in similar areas, but 2 courses higher for the scenario estimated for the 2067 sea level (Figure 6).
In this structural analysis we mainly focused on the areas joint opening and the maximum level of joint opening, and the levels of horizontal and vertical displacements and velocities. The analysis revealed maximum horizontal and vertical displacement of around 83 mm and 27 mm respectively whereas the maximum joint opening fortunately remained lower than the height of the vertical keys. Note, that although these values do not sound extreme, they are almost a 100-fold increase compared to what we found for Fastnet Rock. This makes sense. Fastnet was constructed on an elevated rock and was also in contact with a rock mass which supports the structure laterally. Wolf Rock is completely exposed on the mercy of waves and its first course of stones lays under the sea level. Therefore, the impact height, measured from the base of the structure, is considerably bigger for Wolf Rock which results in higher overturning moments and more dramatic structural response.
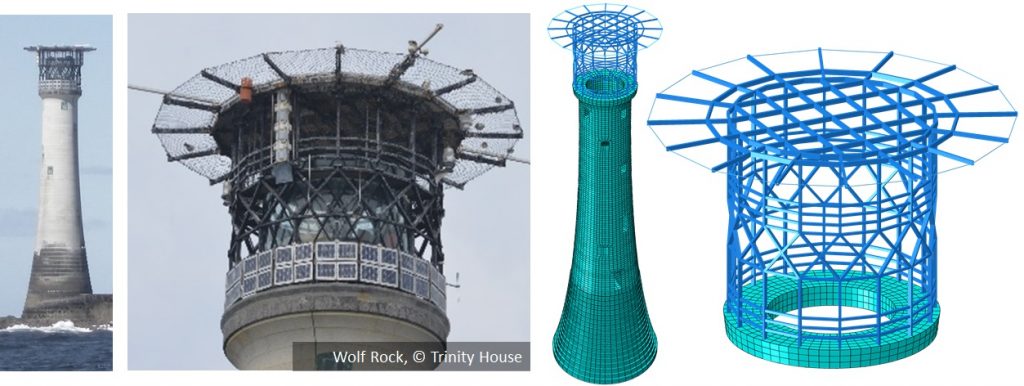
So, what happens if we have to analyse a structure that really needs a FEM approach (e.g. a steel helideck) which is on top of a granite lighthouse (e.g. Wolf Rock, Eddystone, Bishop Rock, Longships, Les Hanois etc.) for which DEM is the best way to proceed? This will be another blog post but you can see our relevant publication here.
Author: Athanasios Pappas, UCL
Leave a Reply